
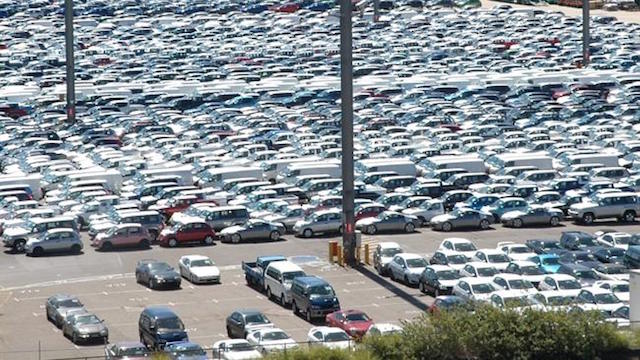
The line between new vehicle registrations and actual sales continues to be very much blurred. Motor Industry Association numbers show a record 127,179 registrations in 2014 – but they don’t show that many thousands of those are still waiting to be sold.
They are sitting in warehouses and sheds around the country, registered last year by distributors and dealers to keep the monthly numbers up in a sales year that turned out to be the best since 1984. But they don’t have buyers’ names on them.
Nothing unusual about it – each year many vehicles are registered and sit on dealers’ yards or distributors’ warehouses before being sold the next year.
But industry executives say there is an unusually large number of registered new vehicles left over from 2014 – perhaps as many as 6000.
They will make their way on to dealers’ yards this year, one reason why sales growth in 2015 is expected to be considerably flatter than last year.
The NZ Transport Agency (NZTA) and MIA record registrations, not sales. Only the distributors would know how many of the vehicles registered were actually sold.
Automotive News NZ has talked to many industry executives and, while they will only talk off the record, they all say the same thing: “There were thousands of cars and light commercials registered with the NZTA last year that weren’t sold.”
The MIA wouldn’t comment officially, its CEO David Crawford saying there was more speculation than fact surrounding the issue.
Distributors work differently. As a rule the big ones push their new vehicle arrivals on to dealers soon after they land at the wharf. The smaller ones store them and wait for dealers to place orders.
Registrations last year were up 12.2 per cent, or 14,062 vehicles, on 2013. Industry executives are split on overall growth in 2015, although most agree SUV and light commercial sales will grow but passenger cars will fall off.
Says the MIA’s Crawford: “The outlook for 2015 is for another strong year, but the MIA does not anticipate significant growth over 2014 volumes.”
Who did what in 2014.
- Of the big three in NZ, Holden was the main mover, up 14.5 per cent on 2013. Ford grew 9.3 per cent and Toyota 4.1 per cent. Of the other main players, Mitsubishi led the way with 25.3 per cent growth, followed by Nissan with 17.4; Mazda 14.5; Honda 13.8; and Hyundai 7.0.
- Mercedes-Benz moved the most among the luxury Germans in 2014, its 1811 passenger car sales up 22.1 per cent on the 1482 it sold in 2013. Audi was next with growth of 14.0 per cent, followed by BMW with 11.4 per cent. The order was reversed in sales: BMW 2126, Audi 2075, Benz 1811. Overall, Benz grew 26.5 per cent, thanks to 781 commercal sales which pushed its numbers to 2592.
- Maserati recorded the highest growth in percentage terms in 2014, up 400 per cent on 2013. Next was Chinese-owned MG with a 308 per cent hike, followed by McLaren with 166.6; Fiat 129.5; Volvo 79.9; Rolls-Royce 75; Renault 69; Land Rover 68.8; Isuzu 60.3; Jeep 56.6; Porsche 52.9; Ssangyong 49.3.
- The lowest year-on-year sales growth was that of Volkswagen’s, up only 0.1 per cent, or six registrations, on 2013. Second was Suzuki, up only 0.2 per cent, or 10 vehicles, on 2013. Third was Lexus, with an extra six vehicles in 2014 for 1.1 per cent growth.
- Only a handful of brands failed to improve on 2013 sales. They were Aston Martin, Chrysler, Ferrari, Great Wall, Jaguar, Lotus, Peugeot.
- Sales of diesel-powered cars and SUVs bought for private and business use dropped 2.4 per cent on 2013. Records show 14,778 such vehicles were registered last year against 15,140 in 2013. That’s 362 fewer vehicles, or around one a day in 2014. Sales of petrol-powered cars and SUVs for private and business use jumped 12.2 per cent on 2013.
- Of the overall 31,420 commerical vehicles registered last year, 29,085 were diesel and 2335 petrol. In 2013, the 26,538 units were split 24,453 diesel/2085 petrol. There is little change in percentage terms year-on-year. Diesel sales in 2014 accounted for 92.5 per cent of commercial numbers; in 2013 it was 92.1 per cent.
- Excluding around 5600 heavy trucks and such, registrations last year were split 40,976 private, 63,407 business, 4395 government, 12,794 rentals. In 2013, they were split 35,715 private, 57,379 business, 4174 government, 11,315 rentals. Year-on-year, private registrations in 2014 were up 14.7 per cent, business 10.5 per cent, government 5.3 per cent, rentals 13.0 per cent.
Year-on-year: First figure is 2013 sales, second is 2014, third is percentage increase/decrease
- Alfa Romeo ……………………………………………………………………………………………….. 195/231 + 18.4%
- Aston Martin …………………………………………………………………………………………….. 25/20 – 20.0%
- Audi …………………………………………………………………………………………………… 1820/2075 + 14.0%
- Bentley ……………………………………………………………………………………………………….. 19/26 + 36.8%
- BMW ……………………………………………………………………………………………………. 1907/2126 + 11.4%
- Chrysler …………………………………………………………………………………………………… 124/98 – 20.9%
- Citroen ……………………………………………………………………………………………………… 300/381 +27.0%
- Dodge ………………………………………………………………………………………………………….540/566 + 4.8%
- Ferrari …………………………………………………………………………………………………………. 20/15 – 25.0%
- Fiat …………………………………………………………………………………………………………453/1040 + 129.5%
- Ford ………………………………………………………………………………………………….. 12,836/14,033 + 9.3%
- Great Wall …………………………………………………………………………………………….. 1024/916 – 10.5%
- Holden ……………………………………………………………………………………………. 11,715/13,422 + 14.5%
- Honda ………………………………………………………………………………………………….. 3121/3554 + 13.8%
- Hyundai …………………………………………………………………………………………………. 7760/8309 + 7.0%
- Isuzu …………………………………………………………………………………………………… 818/1312 + 60.3%
- Jaguar ………………………………………………………………………………………………………… 130/122 – 6.1%
- Jeep ……………………………………………………………………………………………………….. 844/1322 + 56.6%
- Kia ……………………………………………………………………………………………………………. 2803/2856 + 1.8%
- Lamborghini ………………………………………………………………………………………………….. 8/10 + 25.0%
- Land Rover ………………………………………………………………………………………………. 523/883 + 68.8%
- Lexus …………………………………………………………………………………………………………… 551/557 + 1.1%
- Lotus ………………………………………………………………………………………………………………… 6/3 – 50.0%
- Maserati ……………………………………………………………………………………………………. 14/70 + 400.0%
- Mazda …………………………………………………………………………………………………….7098/8128 + 14.5%
- McLaren …………………………………………………………………………………………………………6/16 + 166.6%
- Mercedes-Benz ………………………………………………………………………………………2049/2592 + 26.5%
- MG ……………………………………………………………………………………………………………….12/49 + 308.0%
- Mini ……………………………………………………………………………………………………………490/565 + 15.3%
- Mitsubishi …………………………………………………………………………………………… 6005/7526 + 25.3%
- Nissan ……………………………………………………………………………………………………..6402/7517 + 17.4%
- Peugeot …………………………………………………………………………………………………….1110/1094 – 1.4%
- Porsche ……………………………………………………………………………………………………..189/289 + 52.9%
- Renault ……………………………………………………………………………………………………….175/296 + 69.1%
- Rolls-Royce …………………………………………………………………………………………………………4/7 + 75.0%
- Skoda ………………………………………………………………………………………………………….690/854 + 23.7%
- Ssangyong ………………………………………………………………………………………………1259/1880 + 49.3%
- Subaru ……………………………………………………………………………………………………..1748/1820 + 4.1%
- Suzuki ……………………………………………………………………………………………………….4818/4828 + 0.2%
- Toyota ………………………………………………………………………………………………..23,603/24,692 + 4.1%
- Volkswagen ……………………………………………………………………………………………..5217/5223 + 0.1%
- Volvo ………………………………………………………………………………………………………..234/421 + 79.9%
Top three models in each segment with their percentage of that segment
- Micro: Mitsubishi Mirage (35.4%); Holden Barina Spark (26.5%); Fiat 500 (11.9%).
- Light up to $25,000: Suzuki Swift (26.3%); Toyota Yaris (25.1%); Ford Fiesta (9.5%).
- Light beyond $25,000: Honda Jazz (41.2%); Volkswagen Polo (14.2%); Hyundai Accent (11.8%).
- Small up to $40,000: Toyota Corolla (33.9%); Mazda3 (12.4%); Holden Cruze (9.8%).
- Small beyond $40,000: Volkswagen Golf (45.5%); BMW 116 (13.0%); Audi A3 (5.3%).
- Medium up to $60,000: Toyota Camry (20.1%); Ford Mondeo (13.7%); Mazda6 (13.5%).
- Medium beyond $60,000: Mercedes-Benz C-Class (18.6%); Audi A4 (13.0%); BMW 320d (12.3%).
- Large up to $70,000: Holden Commodore (77.7%); Ford Falcon (17.2%); Skoda Superb (3.2%).
- Large beyond $70,000: Holden HSV (29.1%); Mercedes-Benz E-Class (15.8%); Audi RS6 (10.9%).
- Upper large up to $100,000: Chrysler 300 (49.7%); Holden Commodore (49.7%); Chrysler 300C (0.6%).
- Upper large beyond $100,000: Mercedes-Benz S-Class (26.7%); Maserati Ghibli (22.0%); Maserati Quattroporte (10.0%).
- People movers: Dodge Journey (46.1%); Hyundai iMax (31.2%); Citroen C4 Picasso (4.3%).
- Sports cars up to $80,000: Hyundai Veloster (23.2%); Toyota 86 (18.8%); Kia Koup (8.1%).
- Sports cars beyond $80,000: BMW M4 (22.5%); Mercedes-Benz E-Class (10.3%); Mercedes-Benz C-Class (9.6%).
- Sports car beyond $200,000: Porsche 911 (14.4%); BMW M-Series (10.3%); Porsche Carerra (9.7%).
Top 15 brands
Toyota 24,692 (19%); Ford 14,033 (11%); Holden 13,422 (11%); Hyundai 8309 (7%); Mazda 8128 (6%); Mitsubishi 7526 (6%); Nissan 7157 (6%); Volkswagen 5223 (4%); Suzuki 4828 (4%); Honda 3554 (3%); Kia 2856 (2%); Mercedes-Benz 2592 (2%); BMW 2126 (2%); Audi 2075 (2%); Ssangyong 1880 (1%).
Top 15 passenger cars
Toyota Corolla 6469; Holden Commodore 3001; Suzuki Swift 2685; Toyota RAV4 2562; Toyota Yaris 2557; Mazda CX-5 2371; Mazda3 2370; Holden Captiva 2273; Toyota Highlander 2001; Hyundai ix35 1875; Holden Cruze 1868; Honda Jazz 1861; Hyundai Santa Fe 1850; Ford Focus 1830; Volkswagen Golf 1691.
Top 15 commercials
Ford Ranger 6330; Toyota Hilux 5774; Holden Colorado 2948; Nissan Navara 2515; Toyota Hiace 2443; Mitsubishi Triton 1599; Mazda BT-50 1459; Isuzu D-Max 1231; Ssangyong Actyon Sport 893; Volkswagen Amarok 778; Hyundai iLoad 702; Mitsubishi L300 685; Ford Transit 684; Mercedes-Benz Sprinter 616; Great Wall V240 565.
Top 15 rentals
Toyota Corolla 3046; Toyota Yaris 933; Toyota RAV4 837; Toyota Highlander 822; Ford Focus 757; Holden Commodore 530; Toyota Camry 457; Toyota Hiace 376; Mitsubishi Outlander 314; Toyota Prado 311; Hyundai iMax 307; Mercedes-Benz Sprinter 273; Mazda3 270; Holden Cruze 229; Hyundai ix35 225.